Formula One Qualifying Battles: Hamilton vs Rosberg
Introduction
This post is about evaluating the qualifying battles between Lewis Hamilton and Nico Rosberg, drivers who dominated the Formula One seasons from 2014 to 2016.
The two Mercedes drivers were able to be on pole 18 times in 2014, 18 times in 2015, and 20 times in 2016. Between 2014 and 2016, there were only three races (out of 56) where the Mercedes team did not get pole position:
- Austria 2014: Massa on Williams
- Singapore 2015: Vettel on Ferrari
- Monaco 2016: Ricciardo on Red Bull
Method
The most commonly used statistics when evaluating head to head qualifying battles is the simple count of how many times a driver outperformed the other. While this gives a good idea of who was faster, there is more information hidden in the gaps and in circumstances such as mechanical failures.
We will be looking at bar charts showing the race by race gaps between two drivers and characterize the gap distribution.
in order to evaluate the gaps fairly we have to remove outliers. We consider outliers circumstances when one of the two drivers did not make into Q3. It is safe to assume that a driver fighting for the championship will be in Q3 unless something unexpected happens. We also remove gaps above one second because they are usually due to extreme conditions. All the outliers will be extensively described in the next sections.
Hamilton vs Rosberg (2016)
The overall head to head saw Hamilton edging out Rosberg: 12 to 9.
After removing the outliers the head to head turns more into Hamilton’s
favor: 12 to 5
Outliers
Omitted from gaps calculations: China, Russia, Azerbaijan, Belgium
- China: A hybrid system failure in the turbo charger prevented Hamilton from setting a time in qualifying.
- Russia: The same mechanical failure as in China prevented Hamilton from competing in Q3.
- Azerbaijan: Hamilton crashed in Q3 before setting a quick lap time. While this is a case of driver mistake and should be counted as a Rosberg win, we consider it an outlier because the gap is too big and would skew the statistics.
- Belgium: Hamilton took a penalty for changing the engine and did not participate in Q2 and Q3.
Three of the outliers are mechanical failures on Hamilton’s car, while the remaining one is driver mistake in Q3 by Hamilton.
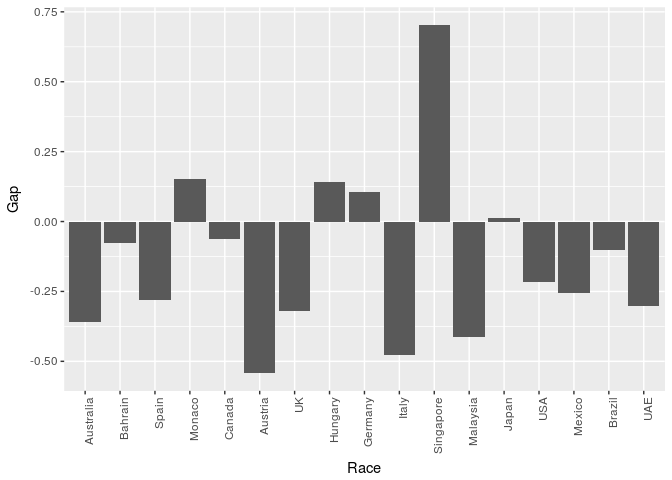
Gap Distribution
Average gap: -0.1347059 Standard deviation: 0.3030734
Hamilton was on average a bit over a tenth faster than Rosberg. When Rosberg was faster, he was usually by a very small margin except for Singapore, where we saw the biggest margin between the two drivers (over 0.7s).
Hamilton vs Rosberg (2015)
The overall head to head saw Hamilton edging out Rosberg: 12 to 7.
After removing the outliers, the gap between the two drivers is wider:
12 to 6.
This result is very similar to the 2016 season. Also to be noted that Rosberg only outqualified Hamilton once in the first thirteen races, and then outqualified Hamilton every single time to the end of the season.

Outliers
Omitted from gaps calculations: USA
- USA: Q3 was canceled because of heavy rain and the Q2 results were used to form the starting grid. Nico took pole position, but we are still omitting the gap from our calculations because at the time of Q2 the drivers were not fighting for pole position.
Gap Distribution
Average gap: -0.1541667 Standard deviation: 0.3190256
Hamilton was on average a bit over a tenth faster than Rosberg, a result very similar to 2016.
Hamilton vs Rosberg (2014)
The overall head to head this time saw Hamilton being edged out by
Rosberg: 7 to 12. After removing the outliers, the result does not
change but it is definitely closer: 6 to 8.

Outliers
Omitted from gaps calculations: China, Austria, UK, Germany, Hungary
- China: Hamilton was slightly more than a second faster than Rosberg on a wet session.
- Austria: Hamilton spun on his second Q3 lap after his first lap was deleted because he exceeded the track limits
- United Kingdom: Q3 was a wet session. Rosberg took pole while Hamilton had his fastest lap too early and the gap was over two seconds.
- Germany: Hamilton crashed in Q1 due to a brake disc failure.
- Hungary: Hamilton’s car caught fire during qualifying.
Gap Distribution
Average gap: 0.0003571429 Standard deviation: 0.2946734
The average gap is incredibly close. Rosberg edged out Hamilton by less than 0.001, a gap that would show as 0.000 on TV.
All Together (2014 to 2016)
The following table shows all the statistics we have encountered side by side.
| Year | Head to Head | Head to Head (No Outliers) | Average Gap | Std Dev |
|---|---|---|---|---|
| 2016 | 12 to 9 | 12 to 5 | -0.1347059 | 0.3030734 |
| 2015 | 12 to 7 | 12 to 6 | -0.1541667 | 0.3190256 |
| 2014 | 7 to 12 | 6 to 8 | 0.0003571 | 0.2946734 |