Formula One 2017 vs 2016: Lap Times Compared
Introduction
Formula 1 has seen a dramatic improvement in lap times thanks to the new 2017 regulations which allowed teams to design wider cars with a lot more downforce. In the first half of the season, every single pole lap time was faster than its respective time in 2016.
While cars are consistently faster, the improvement varies significantly on a track by track basis.
Lap Times Compared
The following table shows for every race the pole lap times in 2016 and 2017, the absolute and percentage gap between the two, and a link to a YouTube video where you can watch the side by side pole laps.
| Name | Pole 2016 | Pole 2017 | Gap | Percentage | Side by Side |
|---|---|---|---|---|---|
| Australia | 1:23.837 | 1:22.188 | -1.649 | -1.97% | Video |
| China | 1:35.402 | 1:31.678 | -3.724 | -3.90% | Video |
| Bahrain | 1:29.493 | 1:28.769 | -0.724 | -0.81% | Video |
| Russia | 1:35.417 | 1:33.194 | -2.223 | -2.33% | Video |
| Spain | 1:22.000 | 1:19.149 | -2.851 | -3.48% | Video |
| Monaco | 1:13.622 | 1:12.178 | -1.444 | -1.96% | Video |
| Canada | 1:12.812 | 1:11.459 | -1.353 | -1.86% | Video |
| Azerbaijan | 1:42.758 | 1:40.593 | -2.165 | -2.11% | Video |
| Austria | 1:07.922 | 1:04.251 | -3.671 | -5.40% | Video |
| United Kingdom | 1:29.287 | 1:26.600 | -2.687 | -3.01% | Video |
2017 Improvement
Gaps
The following graph shows the race by race gaps between the 2016 and 2017 pole times. All gaps are negative which means 2017 poles always beat 2016 ones.
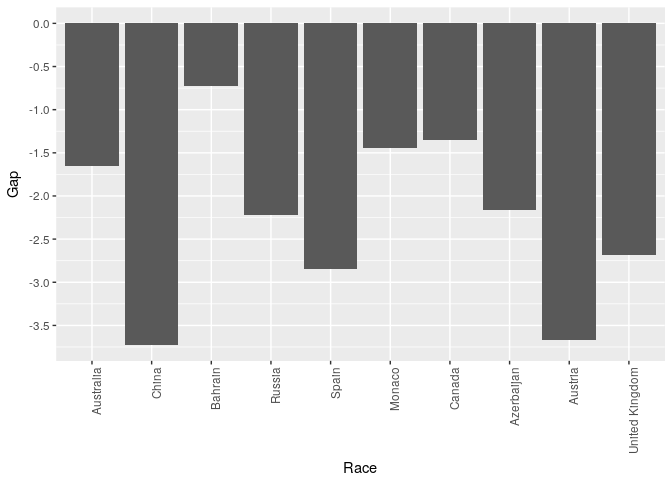
2017 cars are faster than 2016 cars but the extent to which they are faster changes on a track by track basis. The tracks that saw the biggest improvement are China, Austria, Spain, and the United Kingdom. What these tracks have in common is that they have a lot of high speed corners.
The explanation for this is that there is a quadratic relationship between speed and downforce so the improvements in downforce have a significantly bigger impact on high speed corners. At twice the speed, four times the amount of downforce will be generated.
This effect is confirmed by the pole time in Monaco, which saw a close to average improvement. While downforce is important in Monaco, most corners are low or medium speed corners which means an improvement in downforce is not as visible as in Austria or China.
Percentage
The following graph shows the race by race percentage improvement relative to the 2016 pole lap time.

While the gap in China (-3.724) is a tiny bit bigger in absolute value than the one in Austria (-3.671), looking at the percentages makes the improvement in Austria stand out because the almost four seconds gained are over the shortest lap time throughout the season.
The mean and median of the percentage improvement are -2.68% and
-2.22%. After ten races and halfway through the season, it is fair to
say that 2017 cars are over 2% faster than cars in the 2016 season.
Conclusion
The 2017 season has had a lot to offer so far. The championship battle has been intense and the faster cars make it interesting to even just track how much faster are they going compared to previous seasons.
In the second half of the season, tracks with a lot of high speed corners are definitely Spa (Belgium) and Suzuka (Japan), although also Interlagos (Brazil) and Austin (Texas) could be significantly quicker.