Chicago Temperatures
Introduction
This blog post is about temperatures in Chicago. The main goal is to analyze patterns about temperatures in different months and the duration of Chicago winters.
Dataset
The dataset was downloaded from the National Oceanic and Atmospheric Administration’s (NOAA) Climate Data Online portal and contains the temperatures recorded at the Chicago Midway weather station.
A subset of this dataset is utilized in the official Chicago temperature dataset (Climate of Chicago). It was chosen for this analysis because of its completeness.
Month Analysis
This section is about characterizing temperatures over different months in Chicago.
We want to get an idea of what the coldest and hottest months are and also learn about the temperature variability.
The following graphs show the temperature ranges for every month. Here’s how to read the graph:
- The red and blue boxes contain data between the 25th and the 75th percentile for maximum and minimum temperatures respectively
- The horizontal lines inside those boxes represent the average
- The vertical lines coming out of the boxes are the remaining temperatures (before the 25th and after the 75th percentiles)
- The black dots represent outliers
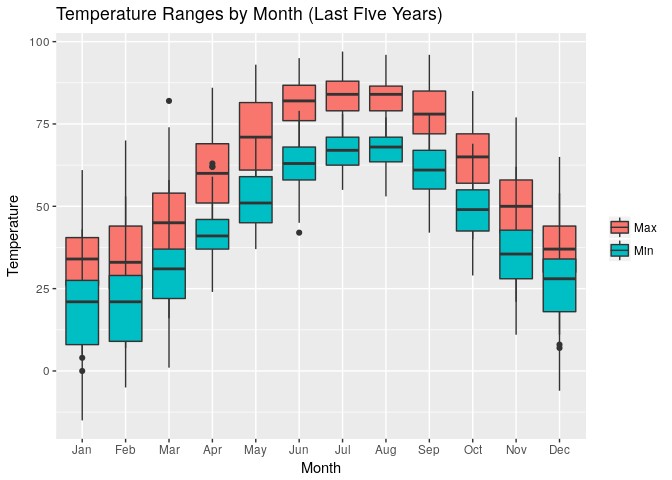
Here are some findings:
- January and February are the coldest months followed by December
- In the past five years, January was slightly colder than February
- The hottest months are the summer months June, July, and August
- The cold months have the highest variability while the hottest months have very little variability
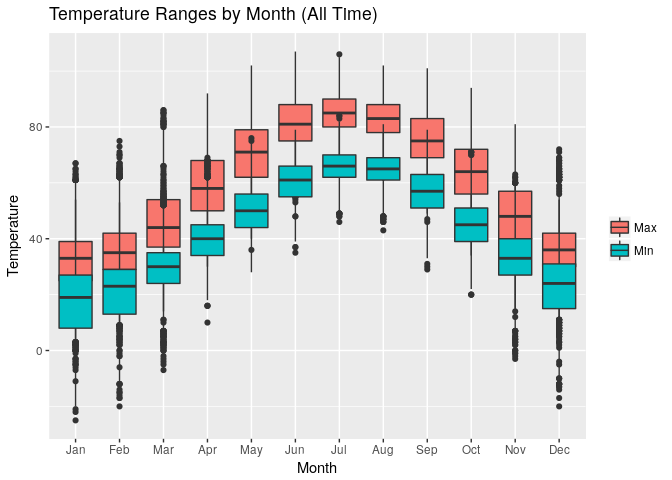
Most findings still hold on the above graph generated using the all time temperatures (since 1930) except that December is roughly as cold as February.
Winter Boundaries
This section is about evaluating the duration of winter in Chicago.
The data that follows was computed using the definition of winter that follows:
- Start: First day after July 31st that is at or below freezing.
- End: Last day on or before July 31st that is at or below freezing.
The July 31st boundary was chosen to be safe since the temperature in July or August was never below 43.
The following plot is a quantile-quantile plot that shows how the distribution is normal because it is roughly linear.

The duration of a Chicago winter follows a distribution that is roughly normal with a mean of 175 and a standard deviation of 19. A typical winter starts around October 26 and ends around April 19.
The following table shows the duration of winter along with winter boundaries for the past five years.
Most Recent five years
| Winter | Start of Winter | End of Winter | Duration |
|---|---|---|---|
| 2016/2017 | 2016-11-19 | 2017-03-23 | 123 |
| 2015/2016 | 2015-11-14 | 2016-04-09 | 147 |
| 2014/2015 | 2014-11-02 | 2015-04-04 | 153 |
| 2013/2014 | 2013-10-22 | 2014-04-16 | 176 |
| 2012/2013 | 2012-11-06 | 2013-04-21 | 165 |
Last years’s winter was an exceptionally short one. Other than that winters have been shorter than average but still within one standard deviation from the mean.
| Winter | Start of Winter | End of Winter | Duration |
|---|---|---|---|
| 1942/1943 | 1942-09-25 | 1943-05-01 | 218 |
| 1980/1981 | 1980-10-05 | 1981-05-12 | 218 |
| 1979/1980 | 1979-10-14 | 1980-05-15 | 214 |
The above table shows some of the toughest winters in Chicago. Some other ones might have been tougher overall becuase of snowfall and average/min temperatures. In any case, 218 days of winter means over 7 months of cold. Luckily we haven’t seen that for a while.