Formula One 2017 vs 2016: Lap Times Compared (Part 2)
Introduction
This is the second part of the Formula One 2016 vs 2017 series. The previous post covered the first half of the 2017 season, where we have seen an average improvement in lap times by 2.68%. This post covers the second half of the 2017 season.
Lap Times Compared
The following table shows for every race the pole lap times in 2016 and 2017, the absolute and percentage gap between the two, and a link to a YouTube video where you can watch the side by side. In some cases the side by side video is not available and the official 2017 pole lap is linked instead.
You might have noticed that the Italian Grand Prix is missing. It was removed from this analysis because the qualifying session was wet in 2017 and dry in 2016 which would make the comparison unfair.
| Name | Pole 2016 | Pole 2017 | Gap | Percentage | Side by Side |
|---|---|---|---|---|---|
| Hungary | 1:19.965 | 1:16.276 | -3.689 | -4.61% | Video |
| Belgium | 1:46.744 | 1:42.553 | -4.191 | -3.93% | Video |
| Singapore | 1:42.584 | 1:39.491 | -3.093 | -3.02% | Video |
| Malaysia | 1:32.850 | 1:30.076 | -2.774 | -2.99% | Video |
| Japan | 1:30.647 | 1:27.319 | -3.328 | -3.67% | Video |
| USA | 1:34.999 | 1:33.108 | -1.891 | -1.99% | Video |
| Mexico | 1:18.704 | 1:16.488 | -2.216 | -2.82% | Video |
| Brazil | 1:10.736 | 1:08.322 | -2.414 | -3.41% | Video |
| Abu Dhabi | 1:38.755 | 1:36.231 | -2.524 | -2.56% | Video |
2017 Improvement
Gaps
The following graph shows the race by race gaps between the 2016 and 2017 pole times. Once again all gaps are negative which means 2017 pole times always beat 2016 ones.

As in the first half of the season, 2017 cars are consistently faster. In terms of lap time the biggest improvement was at the Belgian Grand Prix. That’s a very high speed circuit with a lot of fast corners which is consistent with the prior analysis.
Hungary also has seen a remarkable improvement (~3.7s) which on such a short track is amazing. Look at the side by side to get an idea of the difference. This is somehow unexpected because it is considered to be a low speed circuit often compared to Monaco, even though the two are very different (Monaco is an extremely tight street circuit).
Percentage
The following graph shows the race by race percentage improvement relative to the 2016 pole lap time.
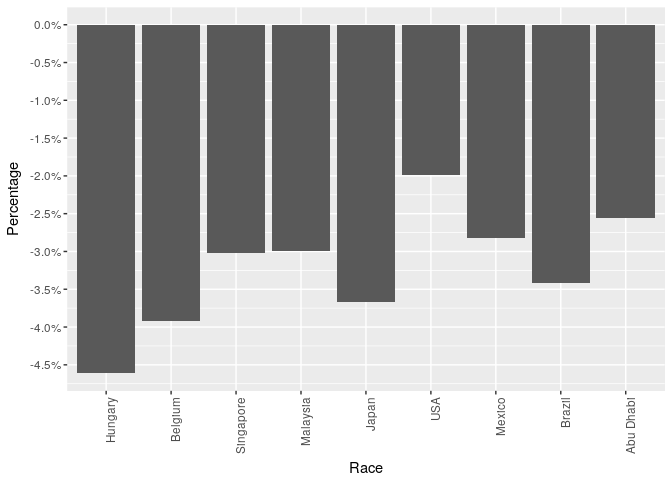
Once again the biggest absolute improvement is not the biggest improvement percentage-wise because tracks have different lengths. The winner is the Hungarian Grand Prix. Others that are remarkably faster are Belgium, Japan, and Brazil, where I mentioned in the previous post’s conclusions that I was expecting large improvements.
The mean and median of the percentage improvement are -3.22% and
-3.02%, the standard deviation is 0.782%. Both the mean and median
improvements are now around 3%, which is a bit higher than in the first
half of the season. One factor that could explain the bigger
improvements is that the circuits in the second half better fit the new
cars. Another possible explanation is that the teams needed some time to
adjust to the new rules to utilize the full potential of their cars. In
other words the 2017 cars might have been underperforming in the first
few races because of teams and drivers needing to adjust to the new
standards.
Conclusion
The 2017 rule changes allowed engineers to build cars that are somewhere between 2% and 3% faster than the previous generation. Personally I found it very exciting to see lap time records being beaten once again.
The 2018 season isn’t going to bring a comparable change of pace but cars should keep getting faster as the 2018 rules are very similar to the ones in 2017.