COVID-19: Growth Rates and Flattening the Curve
Introduction
This blog post is a follow up to COVID-19: United States and Italy. This page contains an update using data as of April 13th as well as a refined methodology.
Countries like Italy and the United States that have been hit hard by the virus have been working on “flattening the curve”, which means slowing down the growth of new cases (and deaths as a consequence) so that the health care system does not get overwhelmed. We will look at curves and growth rates and see that they are indeed slowing down.
Dataset
- For the United States, the data used is from the COVID Tracking Project, which aggregates data from state and local governments
- For Italy, the data is provided by the Civil Protection Department on a Github repository
Both datasets provide time series data about the number of cases, deaths, people being tested, and much more.
Methodology
In the prior post the growth rate was shown of people who tested positive and deaths as of April 4th. In this post we are going to use the same type of data but updated as of April 13th, and do the following:
- Refine the model used for the regression using a sigmoid function instead of a simple exponential function
- Look at how the growth rate (computed using the simple exponential) is changing over time
Growth Curves
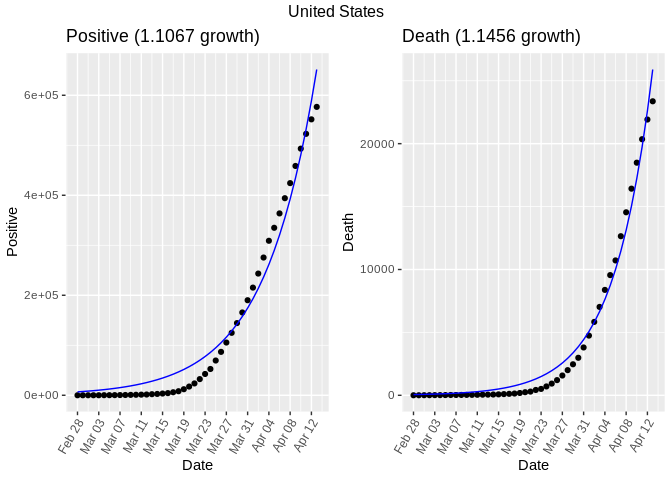
In the prior post we saw that a simple exponential curve was already not a good fit for Italy and for New York State. This because the growth curve had already been flattened in those places. A week later this is true also for the United States at large.
Below is the fitting of a simple exponential function for the United States, which does not fit well any longer.
A sigmoid function is a better fit for the US data:
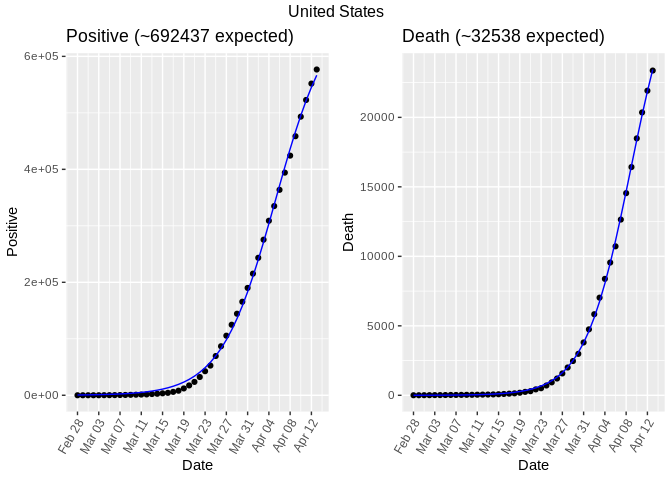
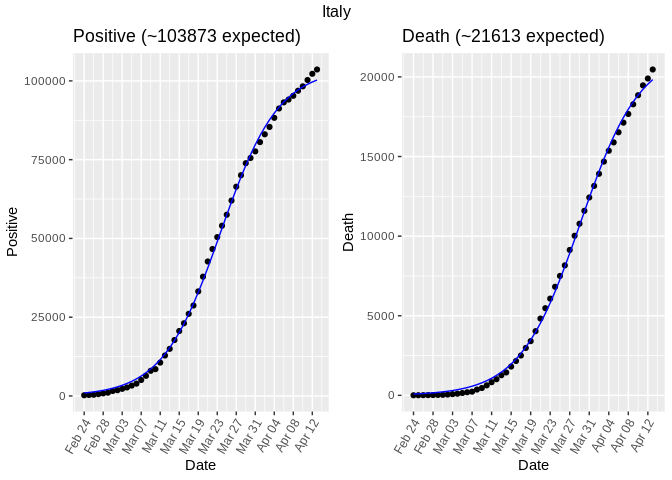
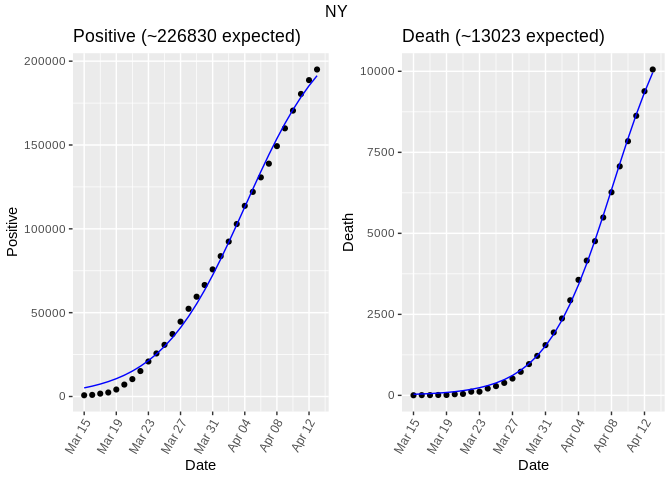
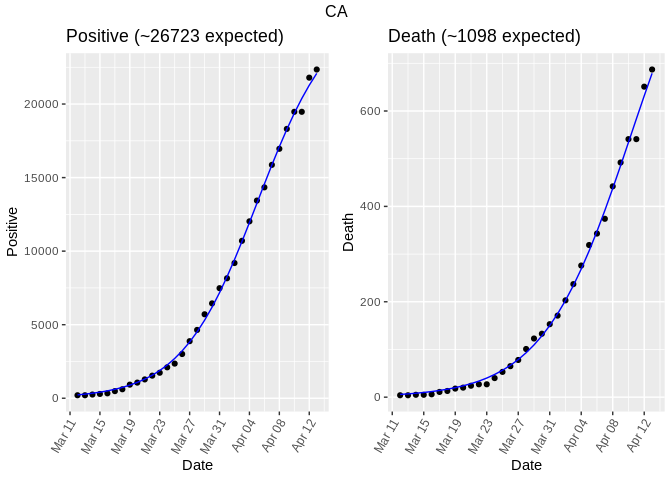
We can also try and predict the totals using learned sigmoid function. The expected total is reported in the graph titles. The sigmoid used in this post is very simple and encodes some assumptions that may not be true (for example that the exponential growth at the beginning and flattening at the end have similar shapes). A better model for predictions that is being cited a lot is the IHME model.
The simple sigmoid prediction gives a similar number to the IMHE model for deaths in Italy (21,613 vs 21,130), but a vastly different number for the United States (32,538 vs 68,841). Even in the IMHE model, the margin of error is very large so we should not rely on those predictions too much. They should though get more accurate over time as we can update parameters or refine models as new data comes in.
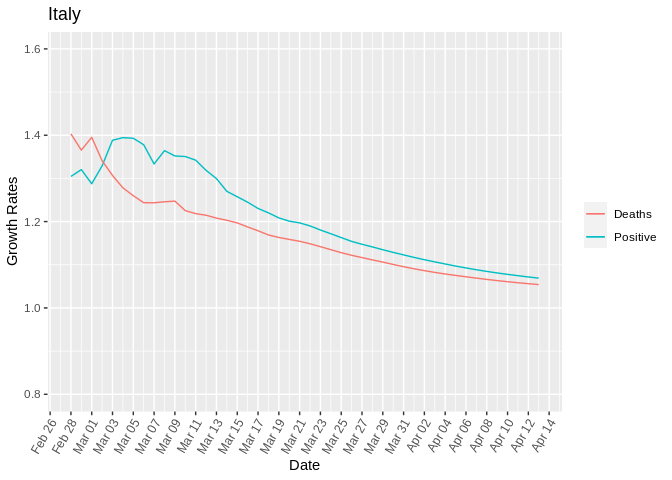
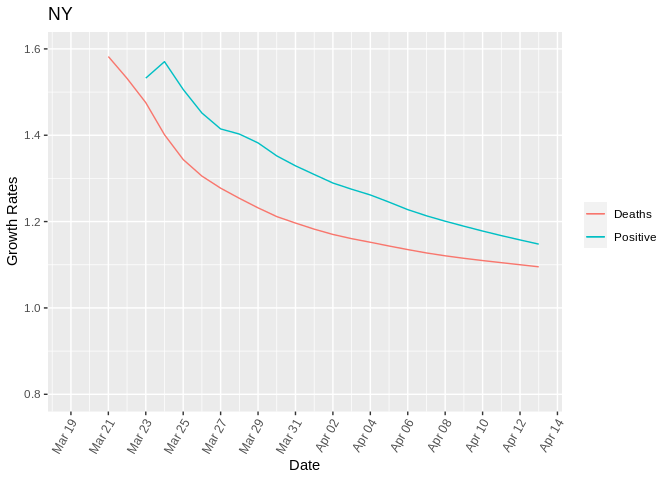
Growth Over Time
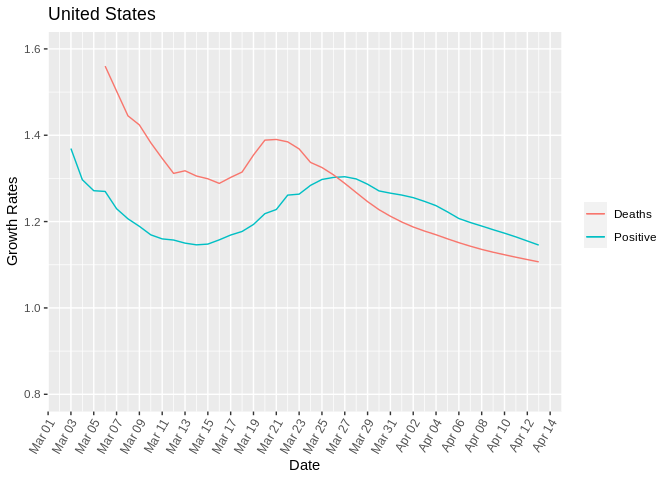
Another piece of data worth following is how the estimated growth rate changes over time. The following graphs show the evolution of the growth rates for positive and deaths. To compute the growth rates for a date, we take all the data on or before that date and estimate the growth rate by fitting an exponential curve.
The growth of new cases and deaths has been recently decreasing in both the United States and Italy, which is good news. Deaths seem to follow new cases (positive) with a lag, especially in this late stage of decrease in both.
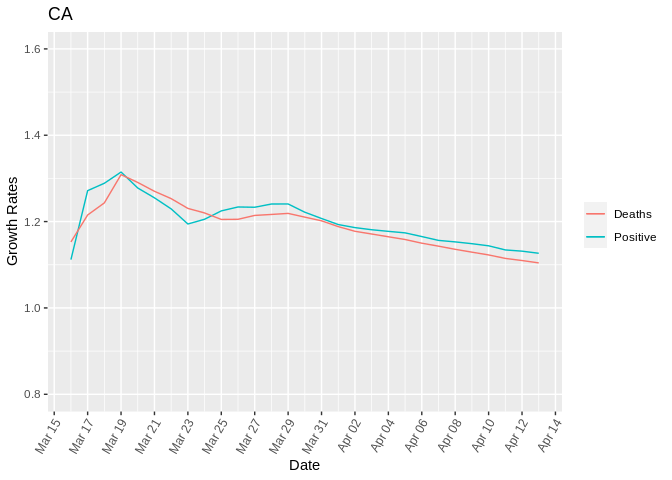
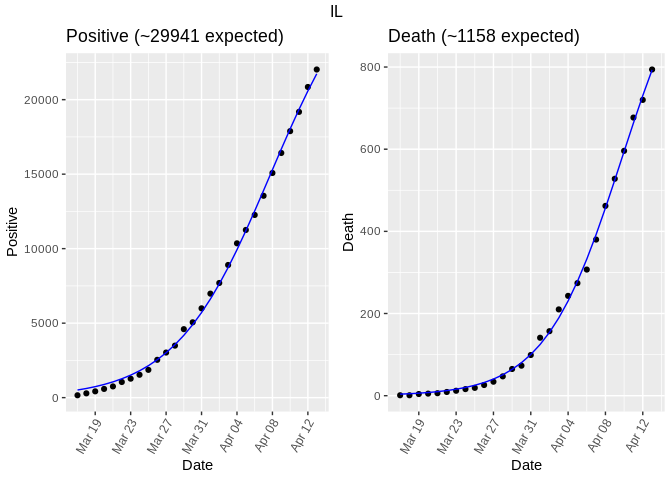
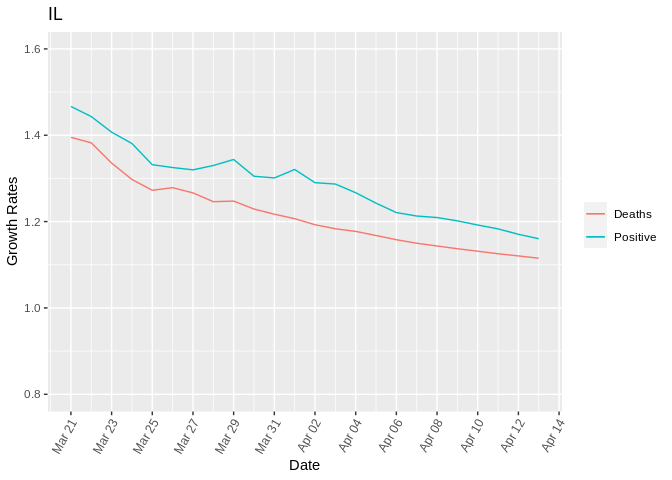
Individual US States
This section shows growth rates for individual US states. I did not have time to do an in depth analysis of the single US states, but I am adding the graphs and data here for readers that might be interested in doing their own assessment. Let me know in the comments if you would like to see the graphs for any particular states.
Below are the side by side graphs for some selected
states.
New York
California
Illinois
Conclusion
We are seeing some encouraging signs that we are past the phase of exponential growth. The sigmoid allowed some nice curve fitting, but we may need refine that further to match reality better in the last phase.
Please leave some comments below with suggestions or things I might have missed.